.avif)
ADOPTION & OPTIMIZATION / DATA & ANALYTICS
See the Business, Don't Guess at It
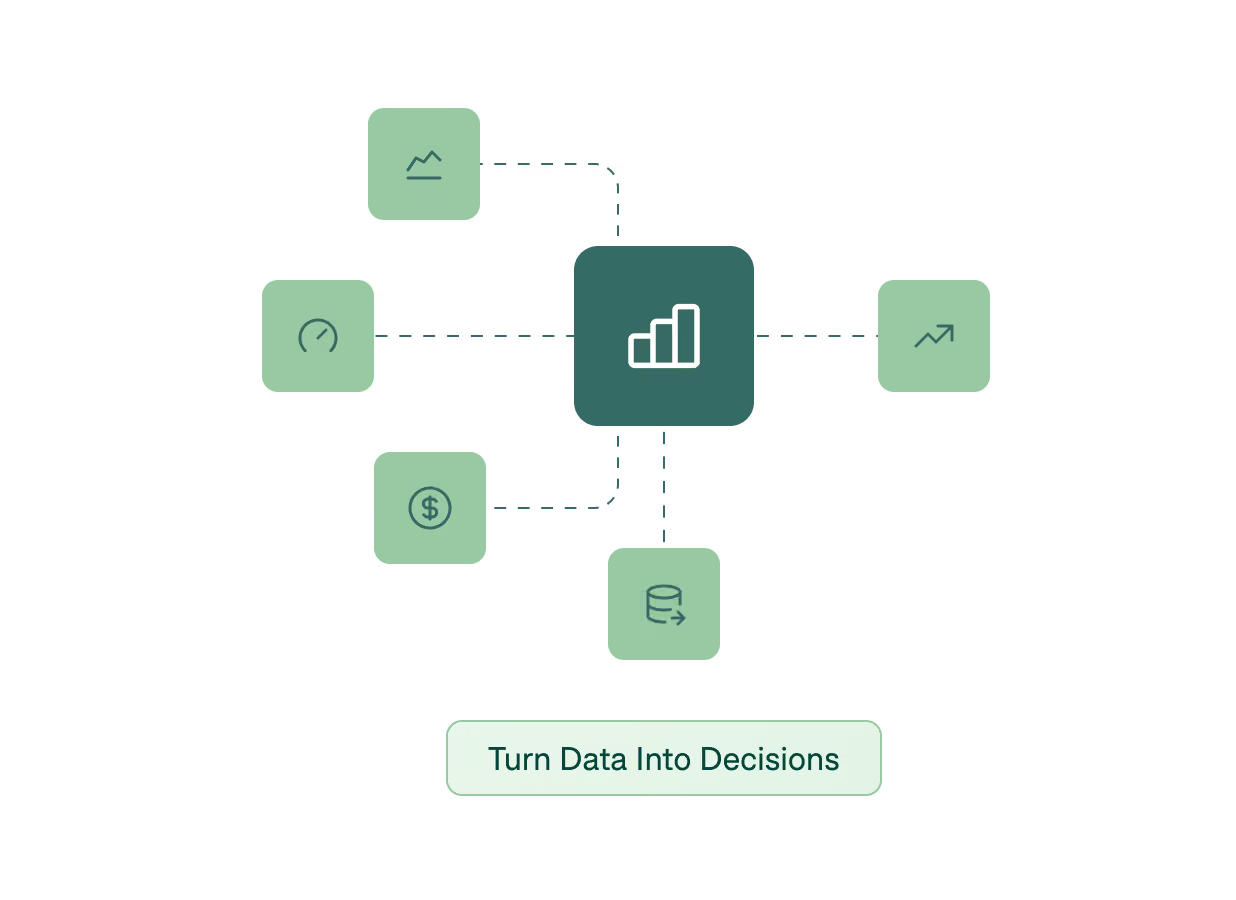
A connected system produces the data to run on, if someone turns it into something leadership can use. Zaelab builds the dashboards, KPIs, and reporting that make pipeline health, service SLAs, and revenue leakage visible instead of assumed.
WHEN IT'S USED
When the Data Is There but the Answers Aren't
A connected Customer to Cash system generates a huge amount of data. But data isn't insight.
When leadership still can't get a straight answer on pipeline health or where revenue is leaking, the problem isn't missing data, it's that nobody has turned it into a view someone can decide from.

WHAT'S INVOLVED
What Data & Analytics Covers

KPI Definition
The numbers that actually matter to the business, agreed before a single dashboard gets built.

Reporting Layers
Data structured and surfaced so it answers the questions leadership is asking.

Dashboards by Role
Views built for who's looking, an executive, a sales lead, and a service manager each need a different picture.

Performance Visibility
Pipeline health, service SLAs, and revenue leakage made continuously visible, so problems surface early enough to act on.

THE OUTPUT
What We Deliver

A defined KPI set tied to business outcomes

Reporting layers built on the platform data

Role-based dashboards for the people making decisions

Ongoing performance visibility across the Customer to Cash journey
PART OF THE WHOLE
Where This Fits in the Work
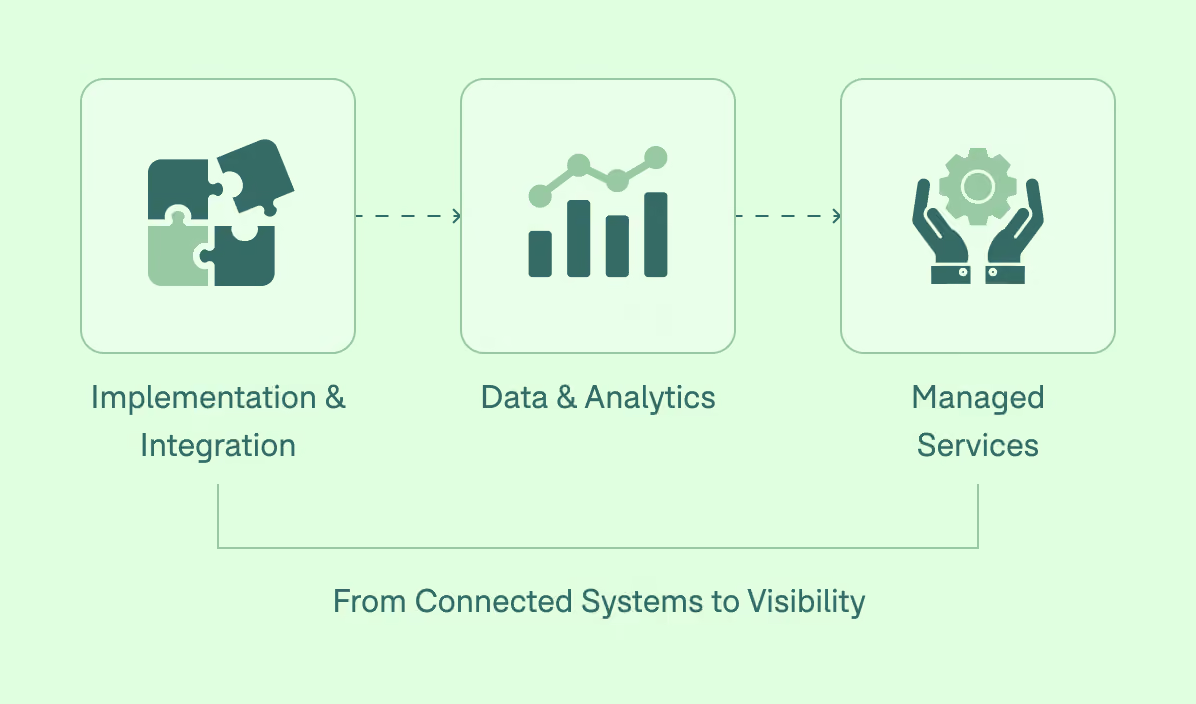
Data & Analytics comes into its own once the systems are connected and running. A connected journey produces clean, complete data, and this is where that data becomes visibility. It pairs closely with Managed Services, where the reporting keeps sharpening over time.
OUR APPROACH
Turning Data Into Decisions.
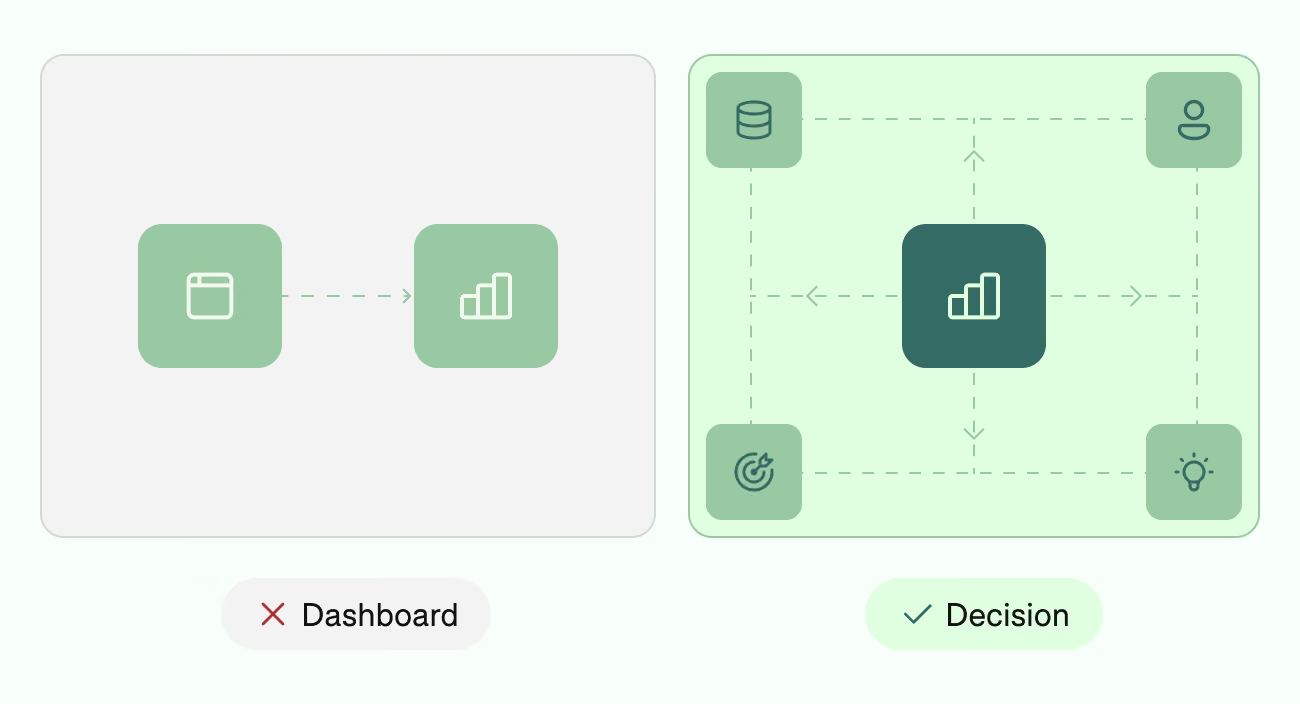
A dashboard is the easy part. The harder part is making it something leadership decides from, tied to the right KPIs, built for the person reading it, and trustworthy enough to act on. Zaelab builds analytics to turn data into decisions.
IN PRACTICE
Trusted by Businesses. Proven Through Results.
Read Success Stories

205%
Revenue Growth
74%
Growth in Traffic
By entering a partnership with Zaelab and implementing a composable commerce accelerator, DTFO was able to personalize its commerce stack and solve the biggest buyer and business challenges alike.

321%
Order Volume Growth Within the First 3 Months
$20M+
Revenue Generated Within the First Few Weeks
After 18 months of limited progress with a previous partner, Zaelab course-corrected and fast-tracked Driven Brands' centralized marketplace on SAP Commerce Cloud.